
Journal of Systems Engineering and Electronics ›› 2026, Vol. 37 ›› Issue (3): 878-896.doi: 10.23919/JSEE.2026.000115
• SYSTEMS ENGINEERING • Previous Articles Next Articles
Lin WANG( ), Yingying PI(), Xuerui WANG()
Received:2024-05-30
Online:2026-06-18
Published:2026-06-29
Contact:
Xuerui WANG
E-mail:wanglin@hust.edu.cn;Piyingying@126.com;d202381550@hust.edu.cn
Supported by:Lin WANG, Yingying PI, Xuerui WANG. Odd-even dimension RUNge Kutta optimization algorithm and its application[J]. Journal of Systems Engineering and Electronics, 2026, 37(3): 878-896.
Add to citation manager EndNote|Reference Manager|ProCite|BibTeX|RefWorks
Table 1
Parameter setting of algorithms"
| Algorithm | Parameter |
| COA | None |
| GA | |
| DE | |
| GBO | |
| WO | |
| GWO | |
| RUN | |
| ODRUN |
Table 2
A comparison of the statistical measures on CEC2022 test functions"
| Function | Indicator | COA | GA | DE | GBO | WO | GWO | RUN | ODRUN |
| Best | 300.00 | 301.17 | 340.71 | 300.00 | 300.00 | ||||
| Mean | 300.00 | 312.77 | 300.00 | 300.00 | |||||
| Std | 1.92E−08 | 9.89 | 3.00E−03 | 6.63E−08 | |||||
| Best | 469.75 | 658.02 | 828.93 | 400.00 | 400.65 | 407.13 | 400.00 | 400.11 | |
| Mean | 405.00 | 429.08 | 425.65 | 403.89 | 406.66 | ||||
| Std | 814.04 | 514.02 | 387.82 | 3.16 | 33.57 | 22.00 | 4.47 | 3.04 | |
| Best | 625.28 | 655.73 | 686.58 | 600.00 | 600.04 | 600.05 | 603.05 | 600.00 | |
| Mean | 648.79 | 660.77 | 704.95 | 600.89 | 600.78 | 601.21 | 614.61 | 600.07 | |
| Std | 9.88 | 4.50 | 9.80 | 2.95 | 0.75 | 1.69 | 6.75 | 0.14 | |
| Best | 834.37 | 872.53 | 907.16 | 810.94 | 808.06 | 803.98 | 812.93 | 801.99 | |
| Mean | 851.23 | 886.71 | 933.83 | 822.15 | 833.91 | 815.96 | 821.92 | 809.29 | |
| Std | 8.86 | 11.83 | 17.19 | 8.27 | 14.08 | 8.26 | 5.08 | 4.18 | |
| Best | 900.09 | 900.00 | 900.02 | 933.47 | 900.00 | ||||
| Mean | 908.20 | 904.37 | 910.98 | 900.40 | |||||
| Std | 199.24 | 205.42 | 11.00 | 4.88 | 19.59 | 46.63 | 0.41 | ||
| Best | 4.42E+05 | 1.48E+08 | 1.38E+08 | ||||||
| Mean | 7.73E+07 | 1.40E+09 | 1.66E+09 | ||||||
| Std | 8.28E+07 | 6.81E+08 | 1.12E+09 | ||||||
| Best | |||||||||
| Mean | |||||||||
| Std | 19.89 | 61.35 | 61.76 | 8.93 | 14.79 | 12.63 | 13.11 | 8.53 | |
| Best | |||||||||
| Mean | |||||||||
| Std | 26.87 | 4.64 | 5.04 | 22.39 | 1.61 | 9.07 | |||
| Best | |||||||||
| Mean | |||||||||
| Std | 58.90 | 229.40 | 274.86 | 26.83 | 10.55 | 39.98 | 37.28 | 0.00 | |
| Best | |||||||||
| Mean | |||||||||
| Std | 362.03 | 132.44 | 542.04 | 57.26 | 63.85 | 56.98 | 59.22 | 0.08 | |
| Best | |||||||||
| Mean | |||||||||
| Std | 332.46 | 0.33 | 152.38 | 181.12 | 132.56 | 150.26 | 1.45E−04 | ||
| Best | |||||||||
| Mean | |||||||||
| Std | 51.25 | 25.55 | 6.11 | 1.73 | 1.71 | 5.81 | 1.39 | 1.25 | |
| Friedman mean rank | 6.42 | 7 | 7.58 | 2.67 | 3.33 | 4.33 | 3.33 | 1.33 | |
| Final rank | 6 | 7 | 8 | 2 | 3 | 5 | 3 | 1 | |
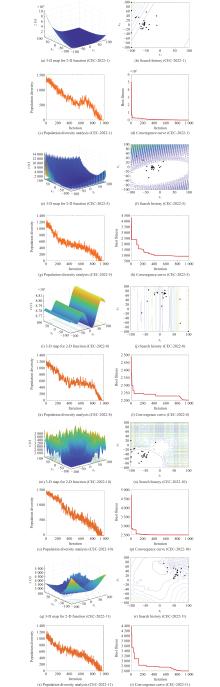
Fig 1
"

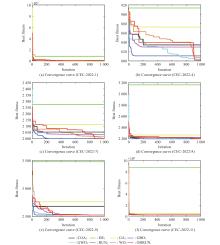
Fig 2
Comparisons of convergence curves for six selected CEC2022 test functions"
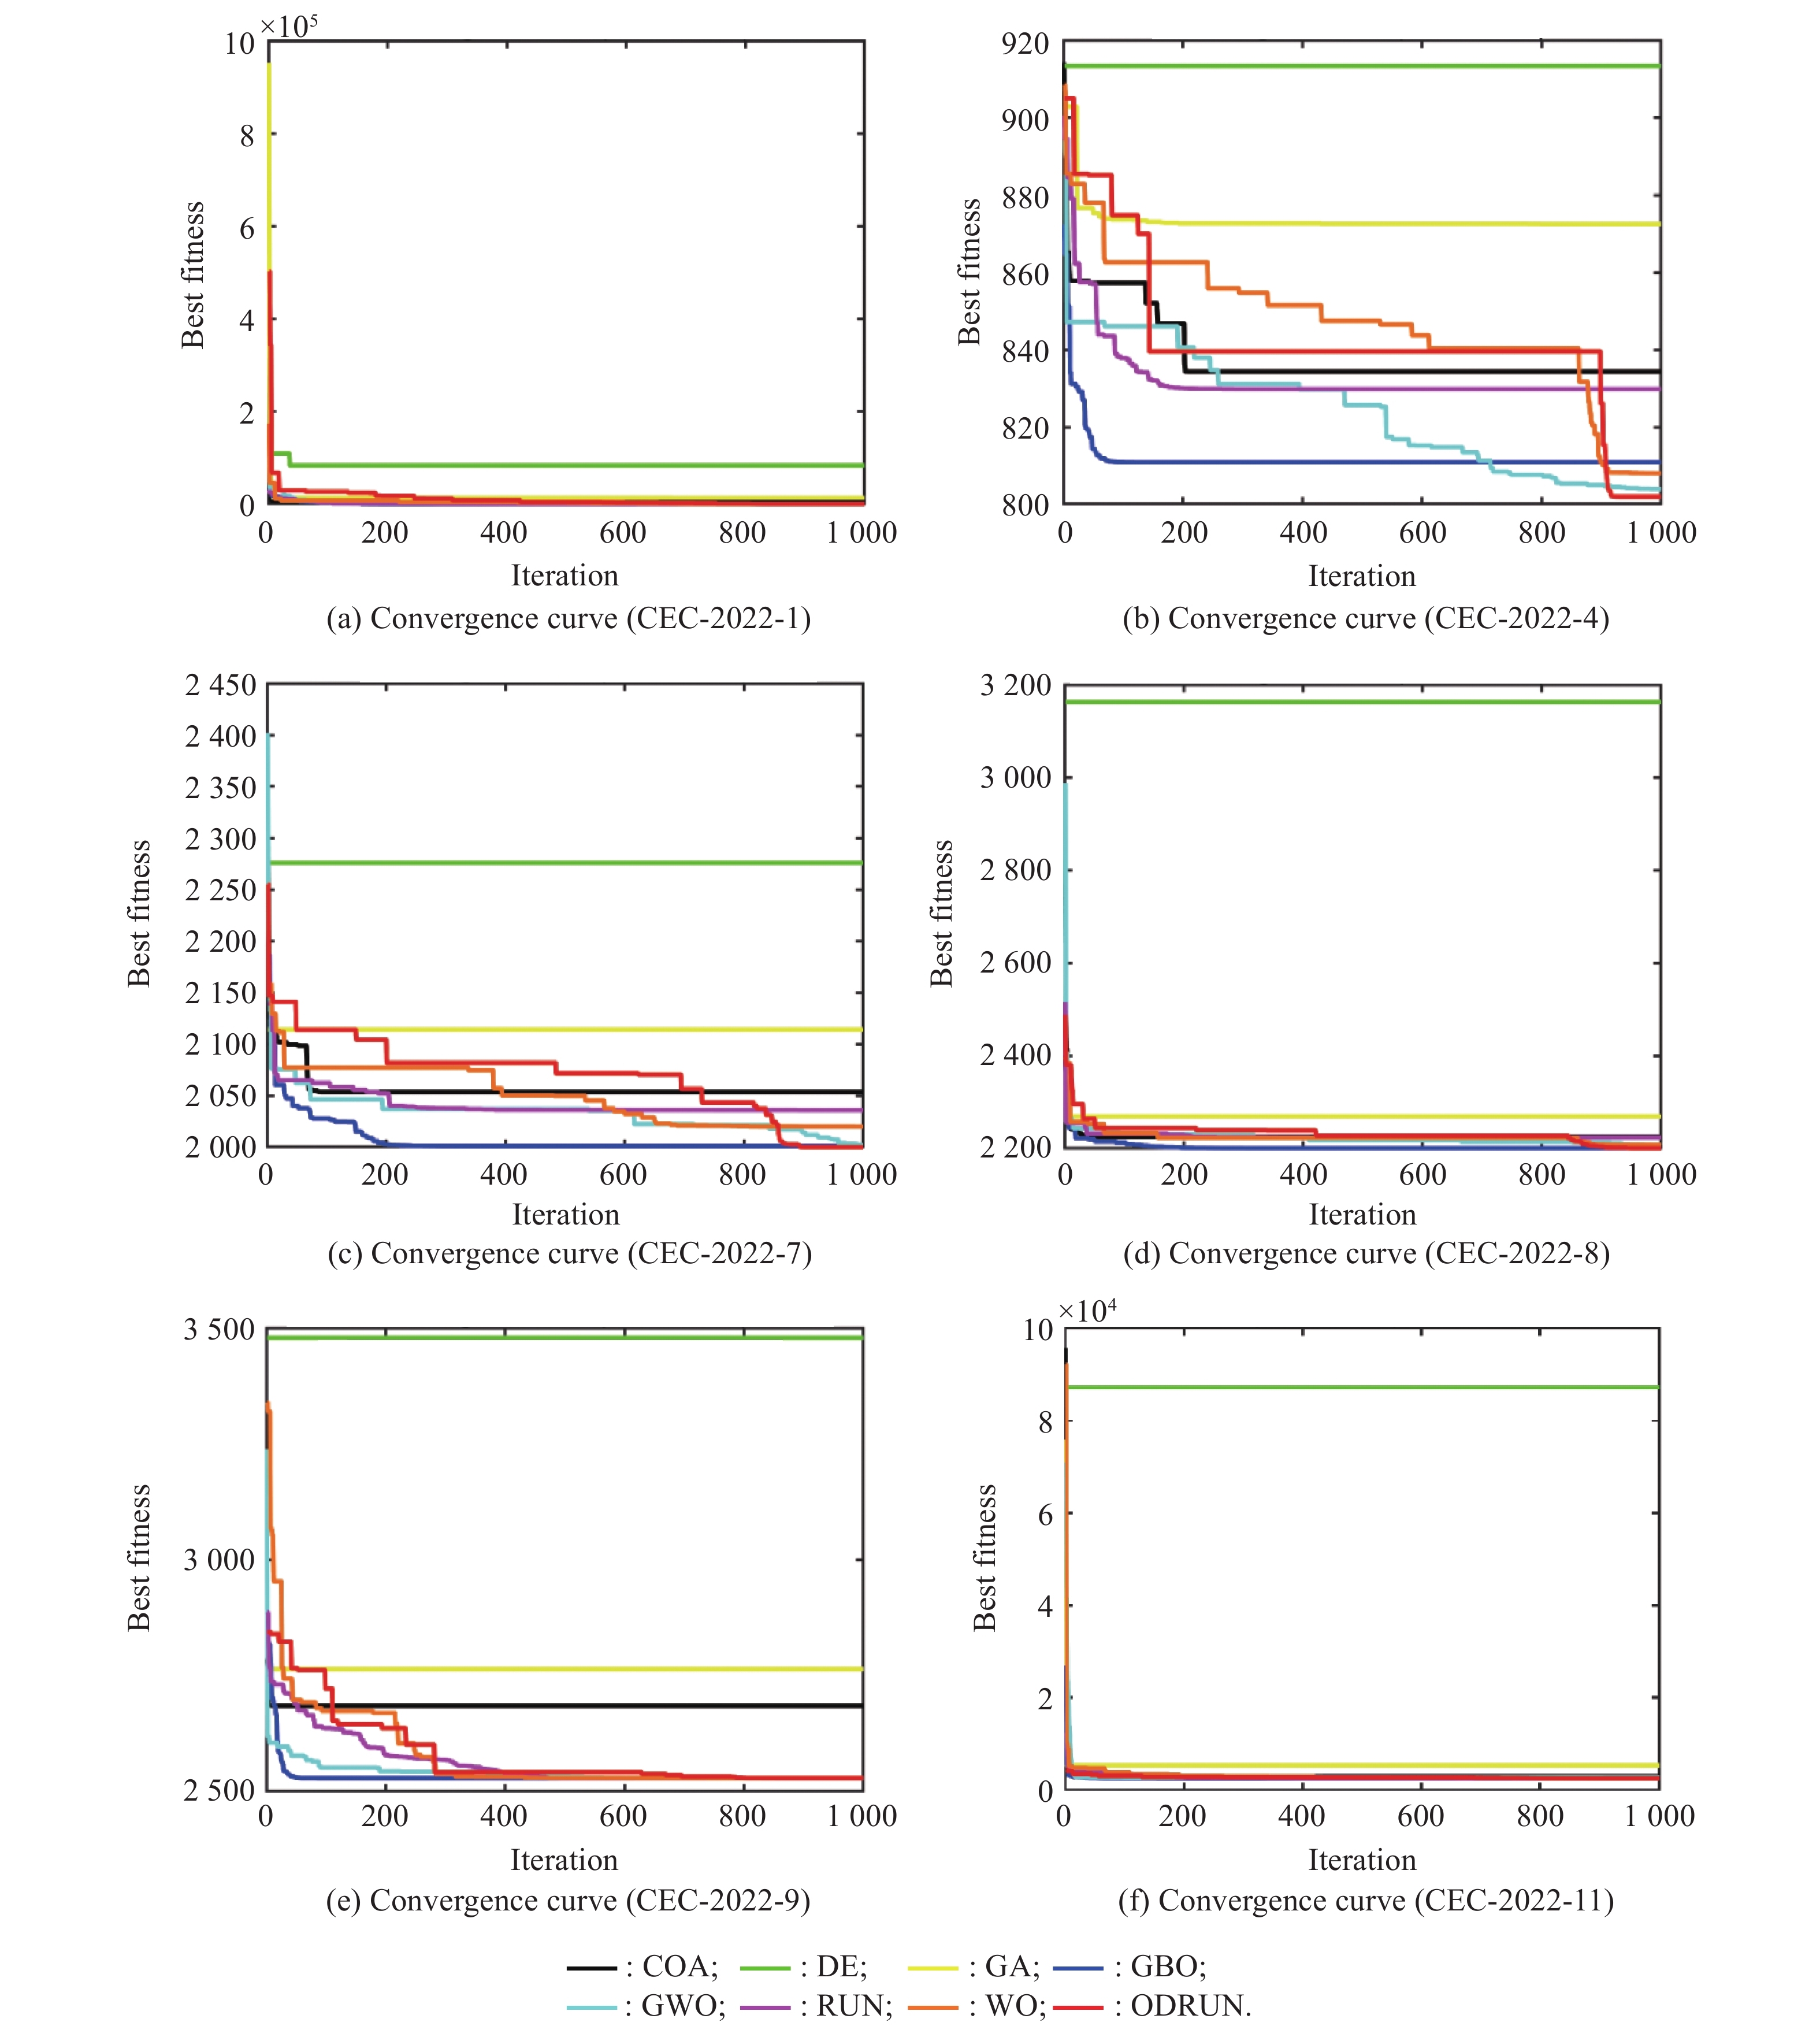
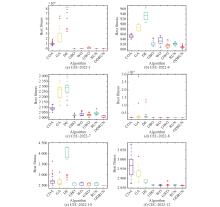
Fig 3
Comparisons of boxplot graphs for six selected CEC2022 test functions"
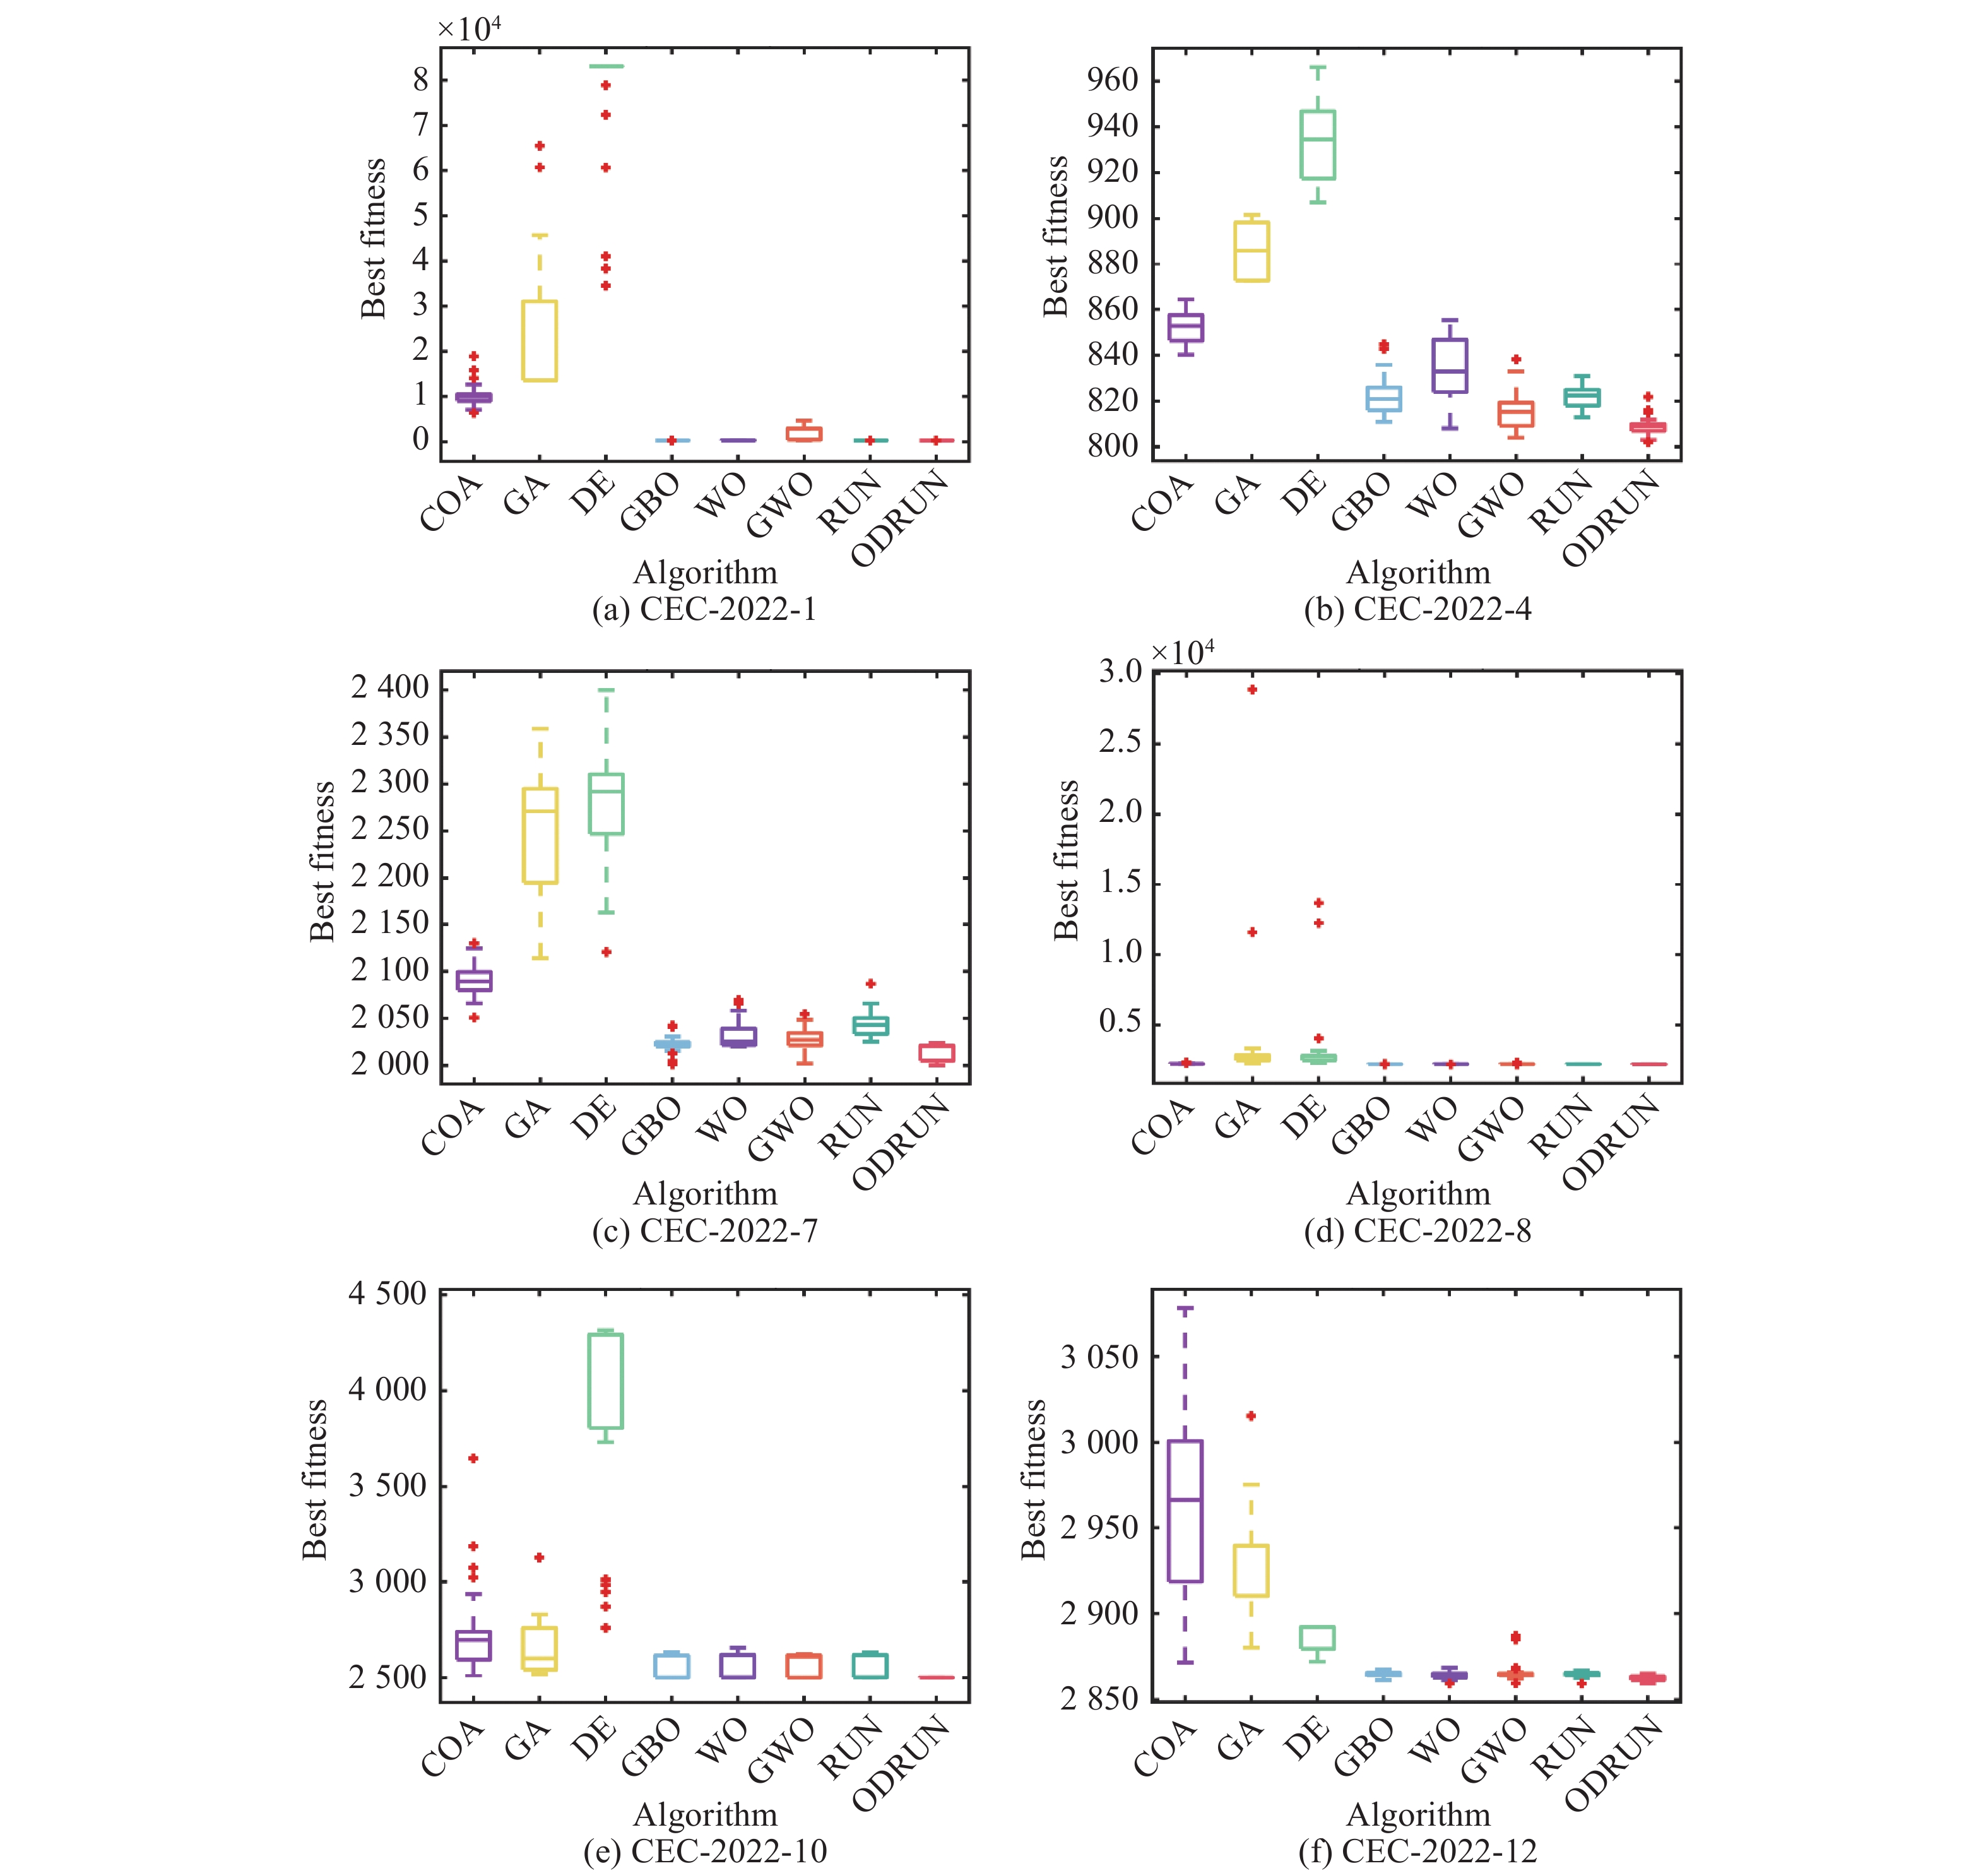
Table 3
Wilcoxon signed test for CEC2022 benchmark functions"
| Function | Statistics | COA | GA | DE | GBO | WO | RUN |
| Sig. | 1.73E−06 | 1.73E−06 | 1.73E−06 | 2.84E−05 | 1.73E−06 | 1.73E−06 | |
| H | 1 | 1 | 1 | 1 | 1 | 1 | |
| Sig. | 1.73E−06 | 1.73E−06 | 1.73E−06 | 4.29E−06 | |||
| H | 1 | 1 | 1 | 1 | 1 | 1 | |
| Sig. | 1.73E−06 | 1.73E−06 | 1.73E−06 | 1.49E−05 | 1.13E−05 | ||
| H | 1 | 1 | 1 | 1 | 1 | 1 | |
| | Sig. | 1.73E−06 | 1.73E−06 | 1.73E−06 | 2.35E−06 | 2.88E−06 | |
| H | 1 | 1 | 1 | 1 | 1 | 1 | |
| | Sig. | 1.73E−06 | 1.73E−06 | 1.73E−06 | 2.60E−06 | 4.73E−06 | |
| H | 1 | 1 | 1 | 1 | 1 | 1 | |
| | Sig. | 1.73E−06 | 1.73E−06 | 1.73E−06 | 3.72E−05 | ||
| H | 1 | 1 | 1 | 0 | 1 | 0 | |
| Sig. | 1.73E−06 | 1.73E−06 | 1.73E−06 | 6.34E−06 | |||
| H | 1 | 1 | 1 | 1 | 1 | 1 | |
| | Sig. | 1.73E−06 | 1.73E−06 | 1.73E−06 | 5.79E−05 | 1.13E−05 | |
| H | 1 | 1 | 1 | 1 | 1 | 1 | |
| Sig. | 1.73E−06 | 1.73E−06 | 1.73E−06 | 3.11E−05 | 1.73E−06 | 1.73E−06 | |
| H | 1 | 1 | 1 | 1 | 1 | 1 | |
| Sig. | 1.73E−06 | 1.73E−06 | 1.73E−06 | 3.18E−06 | 2.16E−05 | 1.73E−06 | |
| H | 1 | 1 | 1 | 1 | 1 | 1 | |
| | Sig. | 1.73E−06 | 1.73E−06 | 1.73E−06 | 1.73E−06 | 1.73E−06 | |
| H | 1 | 1 | 1 | 1 | 1 | 1 | |
| Sig. | 1.73E−06 | 1.73E−06 | 1.73E−06 | 5.79E−05 | 6.04E−03 | ||
| H | 1 | 1 | 1 | 1 | 1 | 1 |
Table 4
Ranks for the mean, best, standard deviation for CEC2022 benchmark functions"
| Algorithm | Mean value rank | |||||||||||||
| Average rank | Final rank | |||||||||||||
| COA | 6 | 8 | 6 | 6 | 6 | 6 | 6 | 6 | 6 | 7 | 6 | 8 | 6.42 | 6 |
| GA | 7 | 7 | 7 | 7 | 7 | 7 | 7 | 8 | 7 | 6 | 7 | 7 | 7.00 | 7 |
| DE | 8 | 6 | 8 | 8 | 8 | 8 | 8 | 7 | 8 | 8 | 8 | 6 | 7.58 | 8 |
| GBO | 1 | 2 | 3 | 4 | 3 | 1 | 2 | 2 | 3 | 2 | 4 | 4 | 2.58 | 2 |
| WO | 4 | 5 | 2 | 5 | 2 | 4 | 4 | 4 | 2 | 4 | 2 | 2 | 3.33 | 3 |
| GWO | 5 | 4 | 4 | 2 | 4 | 5 | 3 | 5 | 5 | 5 | 5 | 5 | 4.33 | 5 |
| RUN | 3 | 1 | 5 | 3 | 5 | 3 | 5 | 3 | 4 | 3 | 3 | 3 | 3.42 | 4 |
| ODRUN | 2 | 3 | 1 | 1 | 1 | 2 | 1 | 1 | 1 | 1 | 1 | 1 | 1.33 | 1 |
| Algorithm | Best value rank | |||||||||||||
| Average rank | Final rank | |||||||||||||
| COA | 6 | 6 | 6 | 6 | 6 | 6 | 6 | 6 | 6 | 7 | 6 | 8 | 6.25 | 6 |
| GA | 7 | 7 | 7 | 7 | 7 | 8 | 7 | 7 | 8 | 6 | 7 | 7 | 7.08 | 7 |
| DE | 8 | 8 | 8 | 8 | 8 | 7 | 8 | 8 | 7 | 8 | 8 | 6 | 7.67 | 8 |
| GBO | 1 | 1 | 1 | 4 | 4 | 1 | 2 | 2 | 1 | 3 | 1 | 5 | 2.17 | 2 |
| WO | 4 | 4 | 3 | 3 | 2 | 3 | 4 | 4 | 3 | 4 | 4 | 3 | 3.42 | 3 |
| GWO | 5 | 5 | 4 | 2 | 3 | 5 | 3 | 3 | 5 | 2 | 5 | 4 | 3.83 | 4 |
| RUN | 3 | 2 | 5 | 5 | 5 | 4 | 5 | 5 | 4 | 5 | 3 | 2 | 4.00 | 5 |
| ODRUN | 2 | 3 | 2 | 1 | 1 | 2 | 1 | 1 | 2 | 1 | 2 | 1 | 1.58 | 1 |
| Algorithm | Standard value rank | |||||||||||||
| Average rank | Final rank | |||||||||||||
| COA | 6 | 8 | 8 | 5 | 6 | 6 | 6 | 6 | 6 | 7 | 7 | 8 | 6.58 | 7 |
| GA | 8 | 7 | 5 | 6 | 7 | 7 | 7 | 8 | 7 | 6 | 2 | 7 | 6.42 | 6 |
| DE | 7 | 6 | 7 | 8 | 8 | 8 | 8 | 7 | 8 | 8 | 8 | 6 | 7.42 | 8 |
| GBO | 1 | 2 | 4 | 4 | 3 | 3 | 2 | 2 | 3 | 3 | 5 | 4 | 3.00 | 2 |
| WO | 4 | 5 | 2 | 7 | 2 | 4 | 5 | 3 | 2 | 5 | 6 | 3 | 4.00 | 5 |
| GWO | 5 | 4 | 3 | 3 | 4 | 5 | 3 | 5 | 5 | 2 | 3 | 5 | 3.92 | 4 |
| RUN | 3 | 3 | 6 | 2 | 5 | 1 | 4 | 1 | 4 | 4 | 4 | 2 | 3.25 | 3 |
| ODRUN | 2 | 1 | 1 | 1 | 1 | 2 | 1 | 4 | 1 | 1 | 1 | 1 | 1.42 | 1 |
Table 5
Five different variants of RUN"
| Variant | Enhanced solution quality scheme | Odd-even dimension strategy | Neighbor search strategy |
| RUN | Yes | No | No |
| RUNOD | Yes | No | Yes |
| RUNNS | Yes | Yes | No |
| RUNDS | Yes | Yes | Yes |
| ODRUN | No | Yes | Yes |
Table 6
Performance ranking of variants"
| Variant | Average rank | Final rank |
| RUN | 4.28 | 5 |
| RUNOD | 3.72 | 4 |
| RUNNS | 3.06 | 3 |
| RUNDS | 2.11 | 2 |
| ODRUN | 1.84 | 1 |
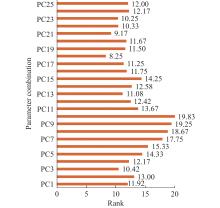
Fig 4
Average rank of different parameter combinations"


Fig 5
Simple description of the proposed IJRPTC"
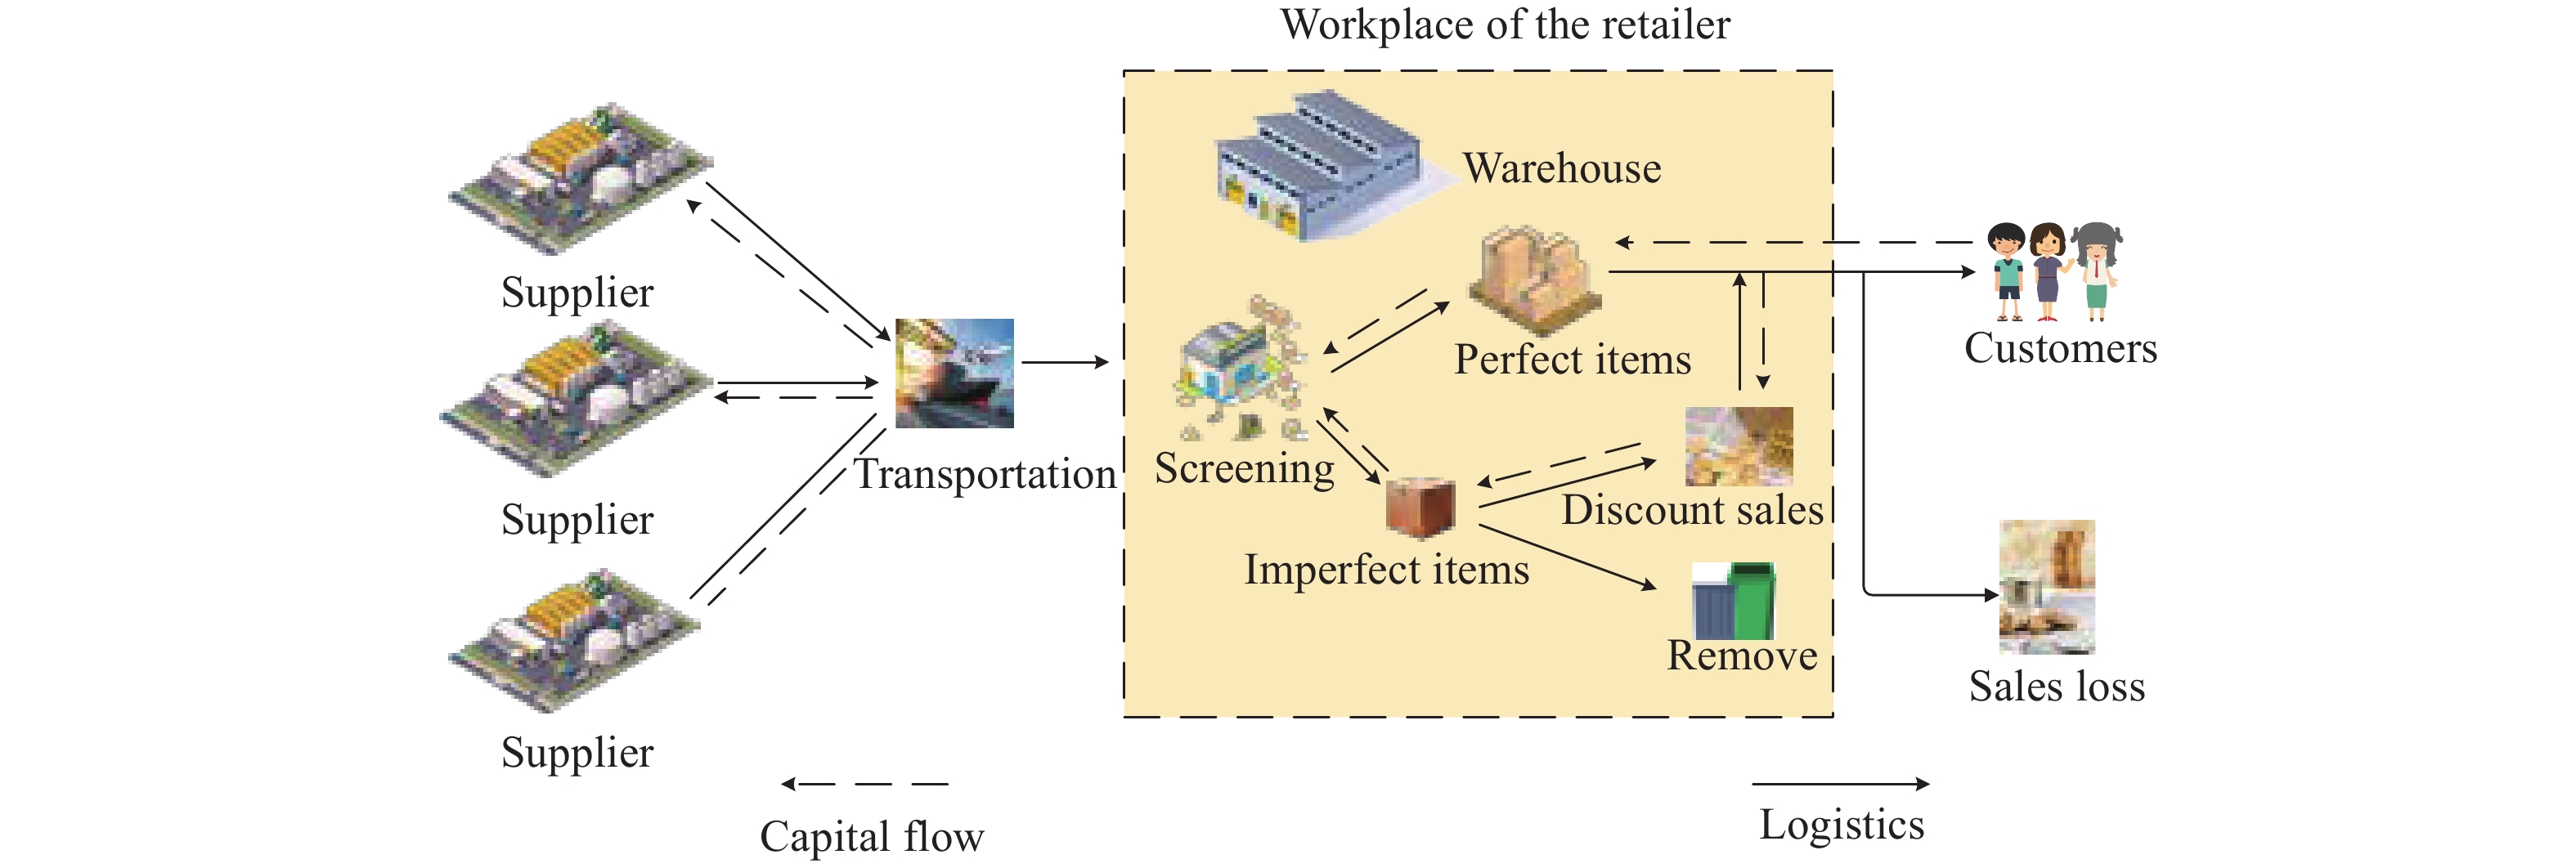
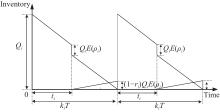
Fig 6
Inventory level of the retailer under the proposed problem"
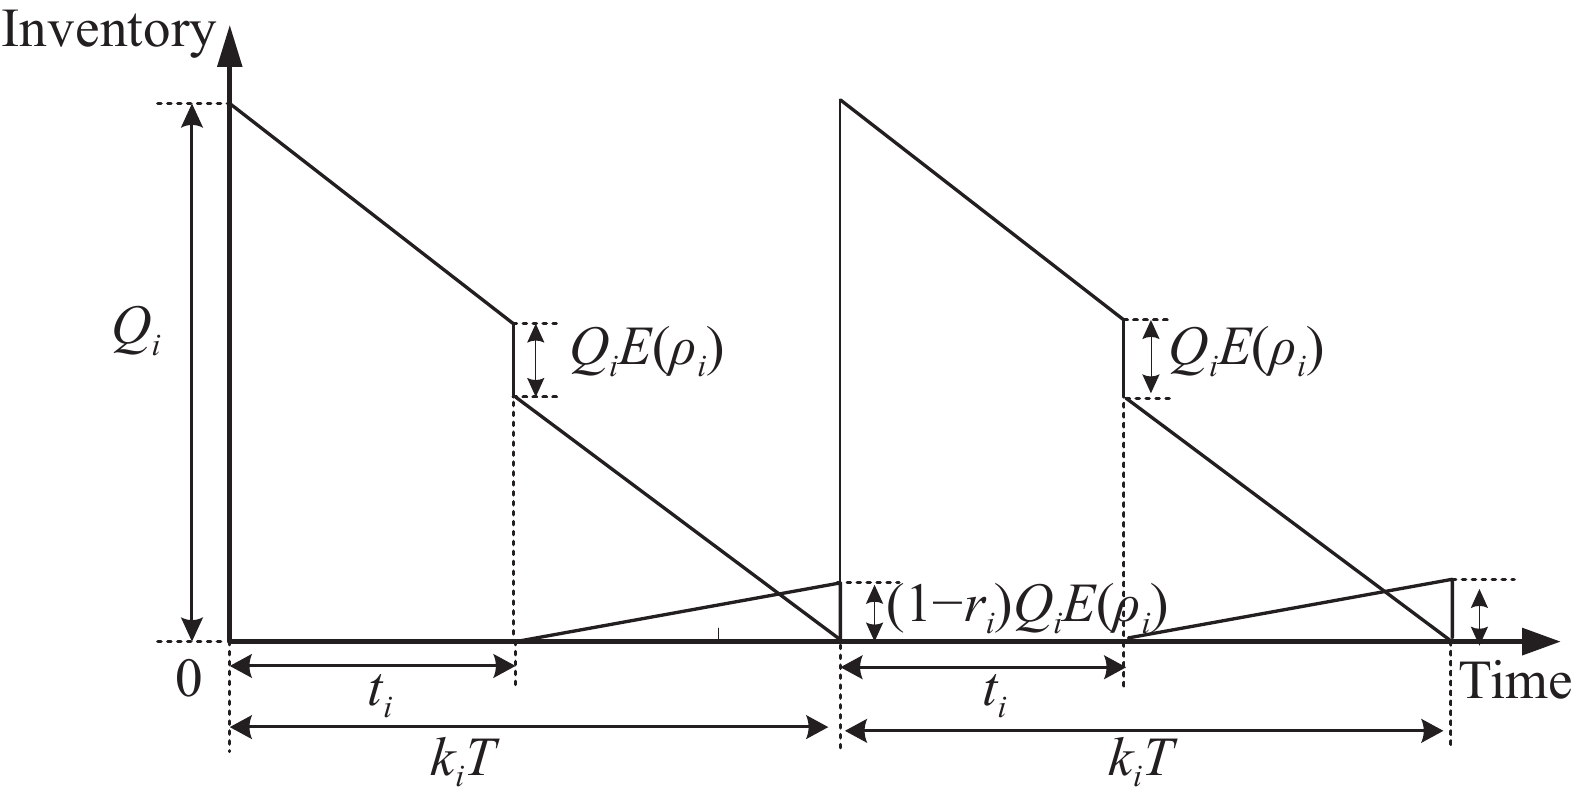
Table 7
Notations description"
| Parameter | Description |
| Number of items | |
| Demand rate for item | |
| The order quantity for item | |
| Major ordering costs associated with each replenishment | |
| Minor ordering cost per order of item | |
| Holding cost per unit of item | |
| The percentage of imperfect products of item | |
| The screening rate for item | |
| The screening cost per unit time for item | |
| The length of the trade credit period | |
| Retail price per unit for the item | |
| Purchasing unit price for the item | |
| Interest charged per dollar by the supplier | |
| Interest earned per dollar for the retailer | |
| The discounted rate for the proportion of imperfect items | |
| The percentage of unusable imperfect items | |
| The loss per unit of unusable imperfect items for item | |
| The screening time for item | |
| Basic cycle time (decision variable) | |
| The integer number that decides the replenishment cycle time of item |
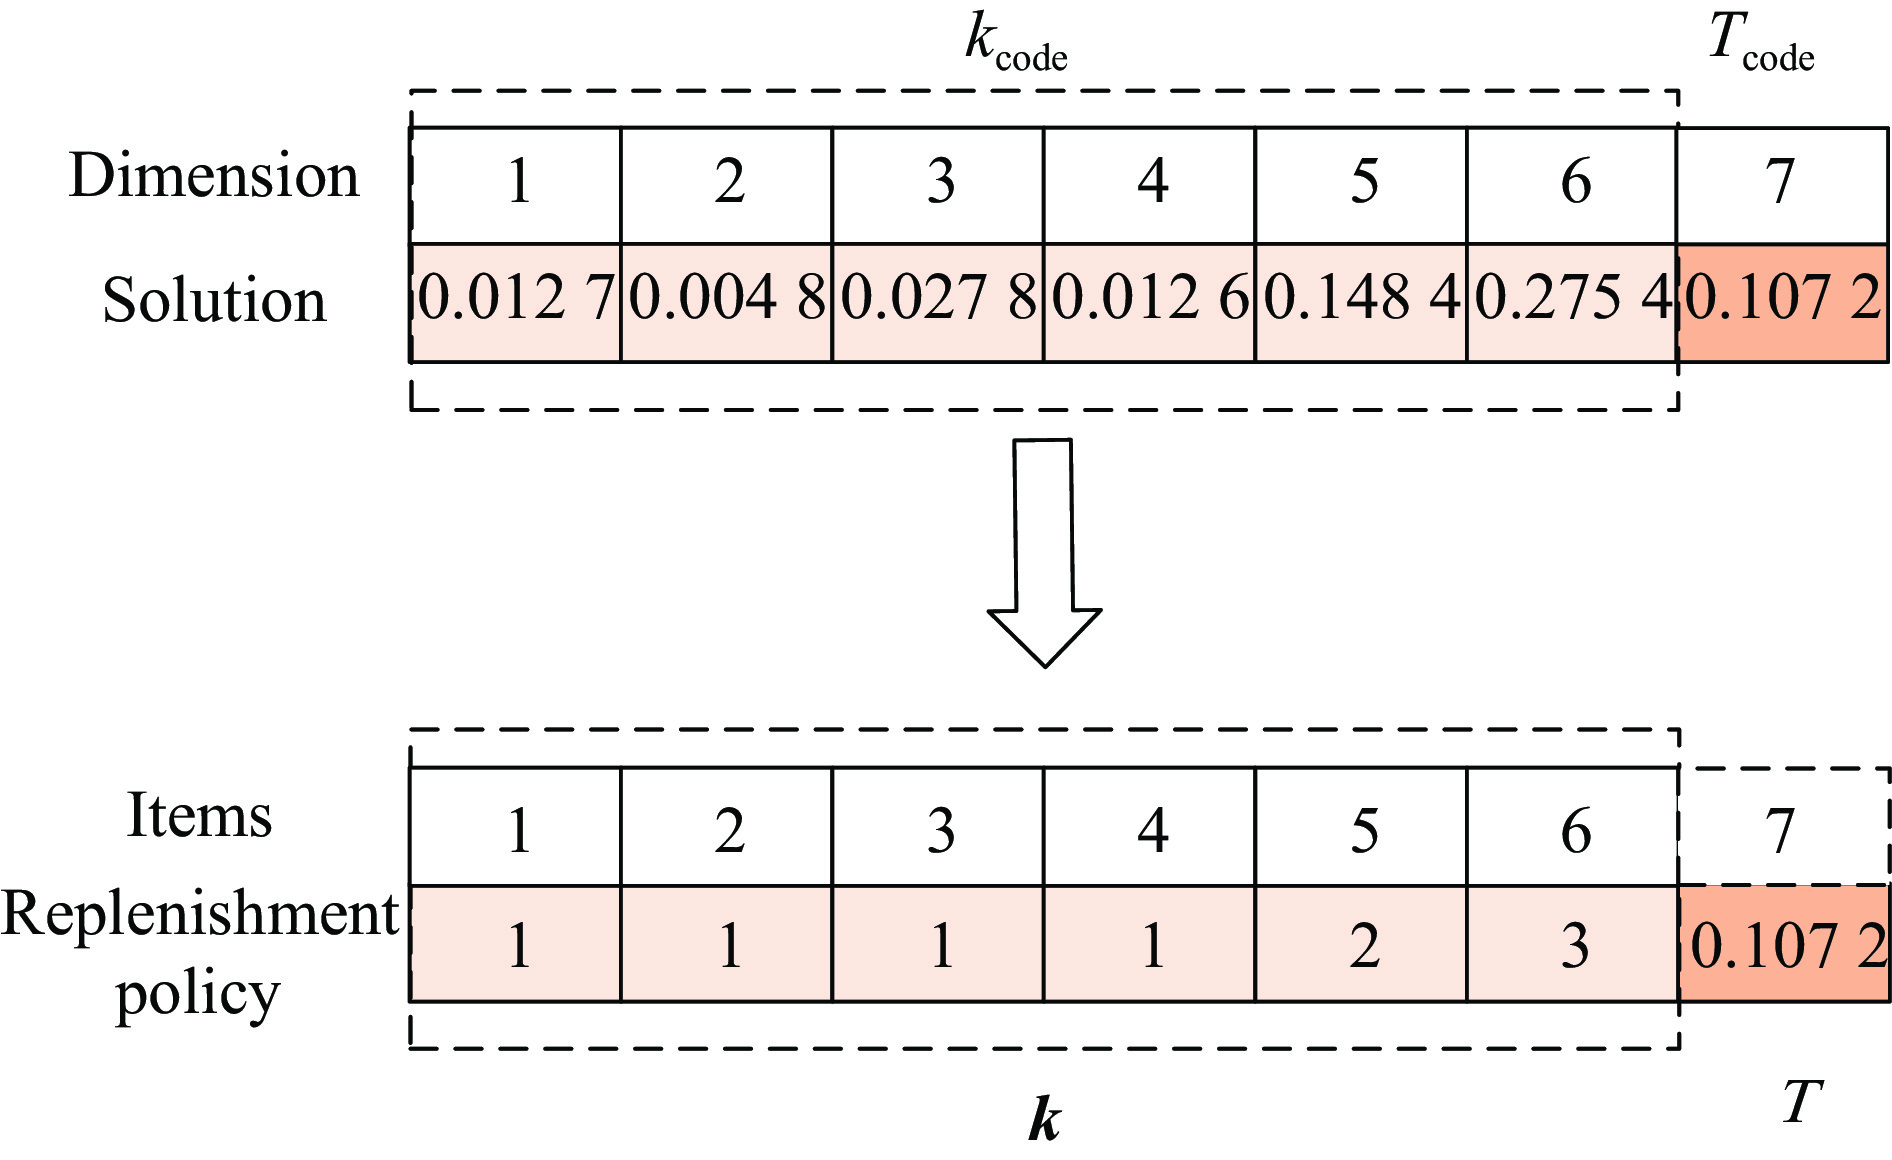
Fig 7
Structure of a solution and decoding transformation (${\boldsymbol{n}} $=6)"
Table 8
Ranges of the parameters"
| Parameter | Range |
Table 9
Comparative results of proposed algorithms under various scale problems (S=150)"
| Indicator | COA | GA | DE | GBO | WO | GWO | RUN | ODRUN | MIR/% | |
| 14 | Best | 14.81 | ||||||||
| Mean | 15.32 | |||||||||
| Standrad | 471.01 | 35.07 | 41.21 | 110.94 | 6.92 | 25.24 | 46.91 | 0.08 | 99.98 | |
| 22 | Best | 15.71 | ||||||||
| Mean | 16.56 | |||||||||
| Standrad | 576.35 | 154.84 | 60.78 | 278.63 | 24.14 | 82.48 | 95.81 | 1.85 | 99.68 | |
| 29 | Best | 16.81 | ||||||||
| Mean | 17.62 | |||||||||
| Standrad | 727.40 | 49.61 | 71.06 | 355.58 | 45.45 | 175.17 | 112.55 | 12.69 | 98.26 | |
| 34 | Best | 16.05 | ||||||||
| Mean | 16.80 | |||||||||
| Standrad | 762.86 | 115.26 | 70.89 | 304.03 | 67.09 | 330.52 | 139.35 | 6.68 | 99.12 | |
| 47 | Best | 17.11 | ||||||||
| Mean | 18.23 | |||||||||
| Standrad | 780.02 | 200.17 | 88.30 | 951.98 | 118.10 | 445.39 | 188.88 | 40.89 | 95.71 | |
| 50 | Best | 17.65 | ||||||||
| Mean | 18.51 | |||||||||
| Standrad | 693.75 | 222.05 | 79.07 | 887.75 | 126.15 | 462.79 | 182.13 | 20.40 | 97.70 | |
| 53 | Best | 17.57 | ||||||||
| Mean | 19.11 | |||||||||
| Standrad | 793.43 | 180.57 | 83.79 | 130.83 | 547.71 | 191.04 | 56.71 | 96.52 | ||
| 60 | Average | 17.87 | ||||||||
| Standrad | 18.97 | |||||||||
| Rank | 698.79 | 221.37 | 82.85 | 141.92 | 589.18 | 202.46 | 32.80 | 97.75 | ||
| 73 | Average | 18.44 | ||||||||
| Standrad | 19.44 | |||||||||
| Rank | 591.92 | 293.44 | 92.97 | 181.29 | 701.74 | 222.35 | 106.59 | 92.23 | ||
| 80 | Average | 17.78 | ||||||||
| Standrad | 19.02 | |||||||||
| Rank | 570.60 | 323.06 | 85.55 | 195.96 | 549.47 | 235.44 | 68.91 | 97.07 |
Table 10
Comparative results of proposed algorithms under various scale problems (S=300)"
| Indicator | COA | GA | DE | GBO | WO | GWO | RUN | ODRUN | MIR/% | |
| 12 | Best | 12.24 | ||||||||
| Mean | 12.35 | |||||||||
| Standard | 18.34 | 71.75 | 0.00 | 21.13 | 7.09 | 1.41 | 15.84 | 0.04 | 99.94 | |
| 14 | Best | 13.46 | ||||||||
| Mean | 13.55 | |||||||||
| Standard | 18.23 | 90.25 | 0.75 | 20.36 | 7.40 | 3.35 | 13.21 | 0.20 | 99.78 | |
| 18 | Best | 14.02 | ||||||||
| Mean | 14.33 | |||||||||
| Standard | 31.65 | 528.98 | 1.36 | 57.75 | 28.06 | 10.55 | 43.53 | 0.52 | 99.90 | |
| 20 | Best | 13.81 | ||||||||
| Mean | 14.11 | |||||||||
| Standard | 36.78 | 629.75 | 7.84 | 60.01 | 26.10 | 8.96 | 39.78 | 0.08 | 99.99 | |
| 33 | Best | 15.84 | ||||||||
| Mean | 16.50 | |||||||||
| Standard | 54.41 | 720.17 | 281.69 | 389.33 | 80.28 | 49.39 | 115.56 | 17.32 | 97.59 | |
| 49 | Best | 16.01 | ||||||||
| Mean | 16.47 | |||||||||
| Standard | 60.20 | 236.74 | 348.67 | 130.70 | 108.10 | 159.48 | 45.85 | 95.79 | ||
| 54 | Best | 16.35 | ||||||||
| Mean | 17.03 | |||||||||
| Standard | 71.96 | 264.34 | 696.64 | 154.16 | 132.27 | 157.59 | 31.01 | 97.27 | ||
| 56 | Best | 16.75 | ||||||||
| Mean | 17.21 | |||||||||
| Standard | 72.18 | 302.91 | 426.30 | 152.58 | 127.72 | 189.03 | 38.48 | 96.57 | ||
| 69 | Average | 17.14 | ||||||||
| Standard | 17.87 | |||||||||
| Rank | 85.63 | 353.65 | 172.69 | 159.40 | 191.34 | 88.64 | 93.42 | |||
| 80 | Average | 17.63 | ||||||||
| Standard | 18.28 | |||||||||
| Rank | 87.79 | 994.13 | 356.35 | 265.52 | 199.51 | 207.07 | 79.92 | 93.00 |
| 1 | HOLLAND J H Genetic algorithms. Scientific American, 1992, 267 (1): 66- 72. |
| 2 |
STORN R, PRICE K Differential evolution–a simple and efficient heuristic for global optimization over continuous spaces. Journal of Global Optimization, 1997, 11 (4): 341- 359.
doi: 10.1023/A:1008202821328 |
| 3 | MIRJALILI S, MIRJALILI S M, LEWIS A. Grey wolf optimizer. Proc. of the Advances in Engineering Software, 2014: 46−61. |
| 4 |
HAN M, DU Z, YUEN K F, et al Walrus optimizer: a novel nature-inspired metaheuristic algorithm. Expert Systems with Applications, 2024, 239, 122413.
doi: 10.1016/j.eswa.2023.122413 |
| 5 |
AHMADIANFAR I, HEIDARI A A, GANDOMI A H, et al RUN beyond the metaphor: an efficient optimization algorithm based on Runge Kutta method. Expert Systems with Applications, 2021, 181, 1115079.
doi: 10.1016/j.eswa.2021.115079 |
| 6 |
YILDIZ B S, MEHTA P, PANAGANT N, et al A novel chaotic Runge Kutta optimization algorithm for solving constrained engineering problems. Journal of Computational Design and Engineering, 2022, 9 (6): 2452- 2465.
doi: 10.1093/jcde/qwac113 |
| 7 |
YE J H, XIE L R, MA L, et al A novel hybrid model based on Laguerre polynomial and multi-objective Runge–Kutta algorithm for wind power forecasting. International Journal of Electrical Power & Energy Systems, 2023, 146, 108726.
doi: 10.1016/j.ijepes.2022.108726 |
| 8 |
HUANG J P, CHEN Y, HEIDARI A A, et al Improved Runge Kutta optimization using compound mutation strategy in reinforcement learning decision making for feature selection. Journal of Bionic Engineering, 2024, 21 (5): 2460- 2496.
doi: 10.1007/s42235-024-00555-x |
| 9 |
ZHANG M L, CHEN H L, HEIDARI A A, et al OCRUN: an oppositional Runge Kutta optimizer with cuckoo search for global optimization and feature selection. Applied Soft Computing, 2023, 146, 110664.
doi: 10.1016/j.asoc.2023.110664 |
| 10 |
QIAO Z L, LI L, ZHAO X C, et al An enhanced Runge Kutta boosted machine learning framework for medical diagnosis. Computers in Biology and Medicine, 2023, 160, 106949.
doi: 10.1016/j.compbiomed.2023.106949 |
| 11 |
CHEN Z Q, KUANG F J, YU S D, et al Static photovoltaic models’ parameter extraction using reinforcement learning strategy adapted local gradient Nelder-Mead Runge Kutta method. Applied Intelligence, 2023, 53 (20): 24106- 24141.
doi: 10.1007/s10489-023-04761-8 |
| 12 |
WANG Y J, ZHAO G H A comparative study of fractional-order models for lithium-ion batteries using Runge Kutta optimizer and electrochemical impedance spectroscopy. Control Engineering Practice, 2023, 133, 105451.
doi: 10.1016/j.conengprac.2023.105451 |
| 13 |
EL-SATTAR H A, KAMEL S, HASSAN M H, et al Optimal sizing of an off-grid hybrid photovoltaic/biomass gasifier/battery system using a quantum model of Runge Kutta algorithm. Energy Conversion and Management, 2022, 258, 115539.
doi: 10.1016/j.enconman.2022.115539 |
| 14 |
NASSEF A M, HOUSSEIN E H, HELMY B E, et al Optimal reconfiguration strategy based on modified Runge Kutta optimizer to mitigate partial shading condition in photovoltaic systems. Energy Reports, 2022, 8, 7242- 7262.
doi: 10.1016/j.egyr.2022.05.231 |
| 15 |
CHEN H L, AHMADIANFAR I, LIANG G X, et al A successful candidate strategy with Runge-Kutta optimization for multi-hydropower reservoir optimization. Expert Systems with Applications, 2022, 209, 118383.
doi: 10.1016/j.eswa.2022.118383 |
| 16 |
WOLPERT D H, MACREADY W G No free lunch theorems for optimization. IEEE Trans. on Evolutionary Computation, 1997, 1 (1): 67- 82.
doi: 10.1109/4235.585893 |
| 17 |
DEHGHANI M, MONTAZERI Z, TROJOVSKA E, et al Coati optimization algorithm: a new bio-inspired metaheuristic algorithm for solving optimization problems. Knowledge-Based Systems, 2023, 259, 110011.
doi: 10.1016/j.knosys.2022.110011 |
| 18 |
AHMADIANFAR I, BOZORG-HADDAD O, CHU X Gradient-based optimizer: a new metaheuristic optimization algorithm. Information Sciences, 2020, 540, 131- 159.
doi: 10.1016/j.ins.2020.06.037 |
| 19 | KUMAR A, PRICE K V, MOHAMED A W, et al. Problem definitions and evaluation criteria for the CEC 2022 special session and competition on single objective bound constrained numerical optimization. Singapore: Nanyang Technological University, 2022. |
| 20 |
QU H, AI X Y, WANG L Optimizing an integrated inventory-routing system for multi-item joint replenishment and coordinated outbound delivery using differential evolution algorithm. Applied Soft Computing, 2020, 86, 105863.
doi: 10.1016/j.asoc.2019.105863 |
| 21 |
WANG S R, WANG L Efficient methods for stochastic joint replenishment and delivery problem. International Transactions in Operational Research, 2022, 29 (4): 2288- 2315.
doi: 10.1111/itor.12905 |
| 22 |
KHOUJA M, GOYAL S A review of the joint replenishment problem literature: 1989–2005. European Journal of Operational Research, 2008, 186 (1): 1- 16.
doi: 10.1016/j.ejor.2007.03.007 |
| 23 |
CREEMERS S, BOUTE R The joint replenishment problem: optimal policy and exact evaluation method. European Journal of Operational Research, 2022, 302 (3): 1175- 1188.
doi: 10.1016/j.ejor.2022.02.005 |
| 24 |
LIU S Y, LIU O, JIANG X M An efficient algorithm for the joint replenishment problem with quantity discounts, minimum order quantity and transport capacity constraints. Mathematics, 2023, 11 (4): 1012.
doi: 10.3390/math11041012 |
| 25 |
COELHO L C, LAPORTE G Optimal joint replenishment, delivery and inventory management policies for perishable products. Computers & Operations Research, 2014, 47, 42- 52.
doi: 10.1016/j.cor.2014.01.013 |
| 26 |
COHEN-HILLEL T, YEDIDSION L The periodic joint replenishment problem is strongly NP-Hard. Mathematical Methods of Operations Research, 2018, 43 (4): 1269- 1289.
doi: 10.1287/moor.2017.0904 |
| 27 |
CUI L, CHEN Y, TIAN Y, et al Response strategies for coping with imperfect items of a joint replenishment model with the adaptive bare-bone differential evolution. Expert Systems with Applications, 2023, 225, 120091.
doi: 10.1016/j.eswa.2023.120091 |
| 28 |
CHEN Y R, YANG L Q, JIANG Y S, et al Joint replenishment decision considering shortages, partial demand substitution, and defective items. Computers & Industrial Engineering, 2019, 127, 420- 435.
doi: 10.1016/j.cie.2018.10.031 |
| 29 |
WANG L, WANG S R, GONG Y, et al Optimizing a multi-echelon location-inventory problem with joint replenishment: a Lipschitz ϵ-optimal approach using Lagrangian relaxation. Computers & Operations Research, 2023, 151, 106128.
doi: 10.1016/j.cor.2022.106128 |
| 30 |
ERSAHIN N, GIANNETTI M, HUANG R Trade credit and the stability of supply chains. Journal of Financial Economics, 2024, 155, 103830.
doi: 10.1016/j.jfineco.2024.103830 |
| 31 |
TARKOM A, YANG L Presidential economic approval rating and trade credit. International Review of Financial Analysis, 2024, 93, 103236.
doi: 10.1016/j.irfa.2024.103236 |
| 32 | CHANG C T, CHENG M C, SOONG P Y. Impacts of inspection errors and trade credits on the economic order quantity model for items with imperfect quality. International Journal of Systems Science: Operations & Logistics, 2016, 3(1): 34−48. |
| No related articles found! |
| Viewed | ||||||
|
Full text |
|
|||||
|
Abstract |
|
|||||